I know there has been discussion about this in a couple threads, but I thought it would be helpful to have one place for people to share and ask questions about the new dashboard.
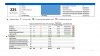
I have attached my screenshot from 10/28/13 for reference. I am also cataloging the daily averages to work on some forecasting. After seeing the big difference in VA Rating phase, it may take a bit to settle down before we can do some accurate forecasting.
For my part, I just sent them feedback through the link in the dashboard as follows. I encourage everyone to submit feedback so this resource will be as accurate and useful as its intent:
---------------------- My Feedback --------------------------------------
I will be direct about the issues. I am an extremely frustrated service member going through the MEB/PEB. This is a great step towards helping to provide some predictability, but there are several problems that need attention.
Days remaining is broke. It is based on estimated finish date, which is not based on any of the data on the dashboard. The average for VA rating phase went from 140 on 28 October to 163 on 29 October. If this is 90-day rolling average that is a significant change and would lead me to believe that it is either a statistical anomaly or a bug.
Being ahead of schedule is based off the Army delta. This is not accurate. The schedule is the mandated 295 and being ahead/behind should reflect that.
For the current phase, the delta is meaningless because the phase is still in process. It should play no factor in performance, because one does not actually know when that phase will complete. If it was the delta from the required timeline then it would show how much further behind the process is failing for the service member.
The completed date for IPEB does not reflect the start date for the VA rating phase. Mine is only 4 days, but others have been significantly more. There needs to be a start date field to provide better transparency.
The graphing engine needs work. I am kicked out of the system frequently. There needs to be an all army historical graph. There needs to be a last 90-day histogram with a distribution curve and standard deviation. The average is meaningless. A better way is to say 80% complete this phase in 140 days +/- 10 days. Do this for 80%, 90% and 95% and it will provide a better predictor for service members and their leaders.
Graphing for my UIC is not helpful. The sample size, even in a WTU is not useful. Trying to graph with parent and child crashes and kicks me out. For that matter, sample size should always be included when discussing any average or distribution.
I have attached my screenshot from 10/28/13 for reference. I am also cataloging the daily averages to work on some forecasting. After seeing the big difference in VA Rating phase, it may take a bit to settle down before we can do some accurate forecasting.
For my part, I just sent them feedback through the link in the dashboard as follows. I encourage everyone to submit feedback so this resource will be as accurate and useful as its intent:
---------------------- My Feedback --------------------------------------
I will be direct about the issues. I am an extremely frustrated service member going through the MEB/PEB. This is a great step towards helping to provide some predictability, but there are several problems that need attention.
Days remaining is broke. It is based on estimated finish date, which is not based on any of the data on the dashboard. The average for VA rating phase went from 140 on 28 October to 163 on 29 October. If this is 90-day rolling average that is a significant change and would lead me to believe that it is either a statistical anomaly or a bug.
Being ahead of schedule is based off the Army delta. This is not accurate. The schedule is the mandated 295 and being ahead/behind should reflect that.
For the current phase, the delta is meaningless because the phase is still in process. It should play no factor in performance, because one does not actually know when that phase will complete. If it was the delta from the required timeline then it would show how much further behind the process is failing for the service member.
The completed date for IPEB does not reflect the start date for the VA rating phase. Mine is only 4 days, but others have been significantly more. There needs to be a start date field to provide better transparency.
The graphing engine needs work. I am kicked out of the system frequently. There needs to be an all army historical graph. There needs to be a last 90-day histogram with a distribution curve and standard deviation. The average is meaningless. A better way is to say 80% complete this phase in 140 days +/- 10 days. Do this for 80%, 90% and 95% and it will provide a better predictor for service members and their leaders.
Graphing for my UIC is not helpful. The sample size, even in a WTU is not useful. Trying to graph with parent and child crashes and kicks me out. For that matter, sample size should always be included when discussing any average or distribution.